


2. Victimization Data Categorized by Age and Type of Crime
| Victim Age in Years | All violent victimizations | Violent rape/sexual assault/b | Intimate partner violence/c | Non-intimate family violence/d | ||
|---|---|---|---|---|---|---|
| Total | 100% | 100% | 100% | 100% | ||
| Juvenile | ||||||
| 0-6 | 2.0 | 16.2 | -- | 7.4 | ||
| 7-11 | 2.6 | 14.7 | -- | 6.3 | ||
| 12-17 | 11.3 | 32.8 | 2.0 | 15.6 | ||
| Adult | ||||||
| 18-24 | 23.0 | 15.3 | 26.4 | 16.1 | ||
| 25-34 | 24.3 | 9.8 | 34.5 | 13.6 | ||
| 35-49 | 23.7 | 7.0 | 28.9 | 22.8 | ||
| 50-64 | 9.8 | 2.3 | 7.5 | 13.6 | ||
| 65 and older | 1.9 | .7 | .8 | 3.9 | ||
| /a | Information for victim age was unknown for 11,136 (1.4%) of victimizations. |
|||||
| /b | Out of victimizations where most serious offense was rape or sexual assault. |
|||||
| /c | Children under the age of 12 were excluded from this analysis. | |||||
| /d | Includes victimizations where non-intimate family was closest relationship present in incident. | |||||
NIBRS can generate a comprehensive, more meaningful picture of crime in a community by providing information on specific types of crime (e.g., violent rape, sexual assault), the relationship of victim to offender (e.g., intimate partner violence, non-intimate family violence), and the victim’s age. This information is valuable to victim services programs that want to tailor their outreach efforts to particular age groups and provide specific services based on this information.
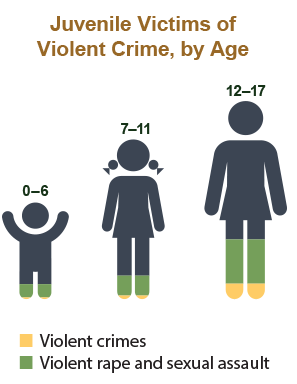
The table above illustrates some of the data that NIBRS collects on patterns of victimization, including age group, relationship, and crime, which can help service providers enhance their response to victims. In 2011, of all violent crime victimizations reported to law enforcement1, 2 percent of the victims were 6 years old or younger, 2.6 percent were 7 to 11 years old, and 11.3 percent were 12 to 17 years old. However, these age groups were victims in 16.2 percent, 14.7 percent, and 32.8 percent of all violent rapes and sexual assaults, respectively. Such a disparity should direct providers to adapt their services to target specific age groups.
This data is also critical for service providers who serve victims of domestic and intimate partner violence. Adults ages 18 to 49 account for 90 percent of the victims of intimate partner violence. By comparing their clients’ data to the local law enforcement agency’s NIBRS data, service providers can identify unserved or underserved victims by age and type of victimization.